
Linear Regression
- Using a direct “closed-form” equation that directly computes the model parameters that best fit the model to the training set (i.e., the model parameters that minimize the cost function over the training set).
- Using an iterative optimization approach called
Gradient Descent (GD)that gradually tweaks the model parameters to minimize the cost function over the training set, eventually converging to the same set of parameters as the first method. We will look at a few variants of Gradient Descent that we will use again and again when we study neural networks in Part II: Batch GD, Mini-batch GD, and Stochastic GD.
Linear Regression model prediction:
\[y = θ_0 + θ_1x_1 + θ_2x_2 + ... + θ_nx_n\]where:
- $y$ is the predicted value.
- $n$ is the number of features.
- $x_i$ is the ith feature value.
- $θ_j$ is the jth model parameter (including the bias term $θ_0$ and the feature weights $θ_1, θ_2, ⋯, θ_n$).
The MSE of a Linear Regression hypothesis $h_θ$ on a training set X is calculated using :
\[\text{MSE}(X, h_θ) = \frac{1}{m}\sum_{i=1}^{m}(\Theta^{T}x^{(i)}-y^{(i)})^2\]Normal Equation:
\[\hat{\theta} = (X^{T}X)^{-1} X^{T} y\]where
- $\hat{\theta}$ is the value of $θ$ that minimizes the cost function.
- $y$ is the vector of target values containing $y^{(1)}$ to $y^{(m)}$.
Computational Complexity
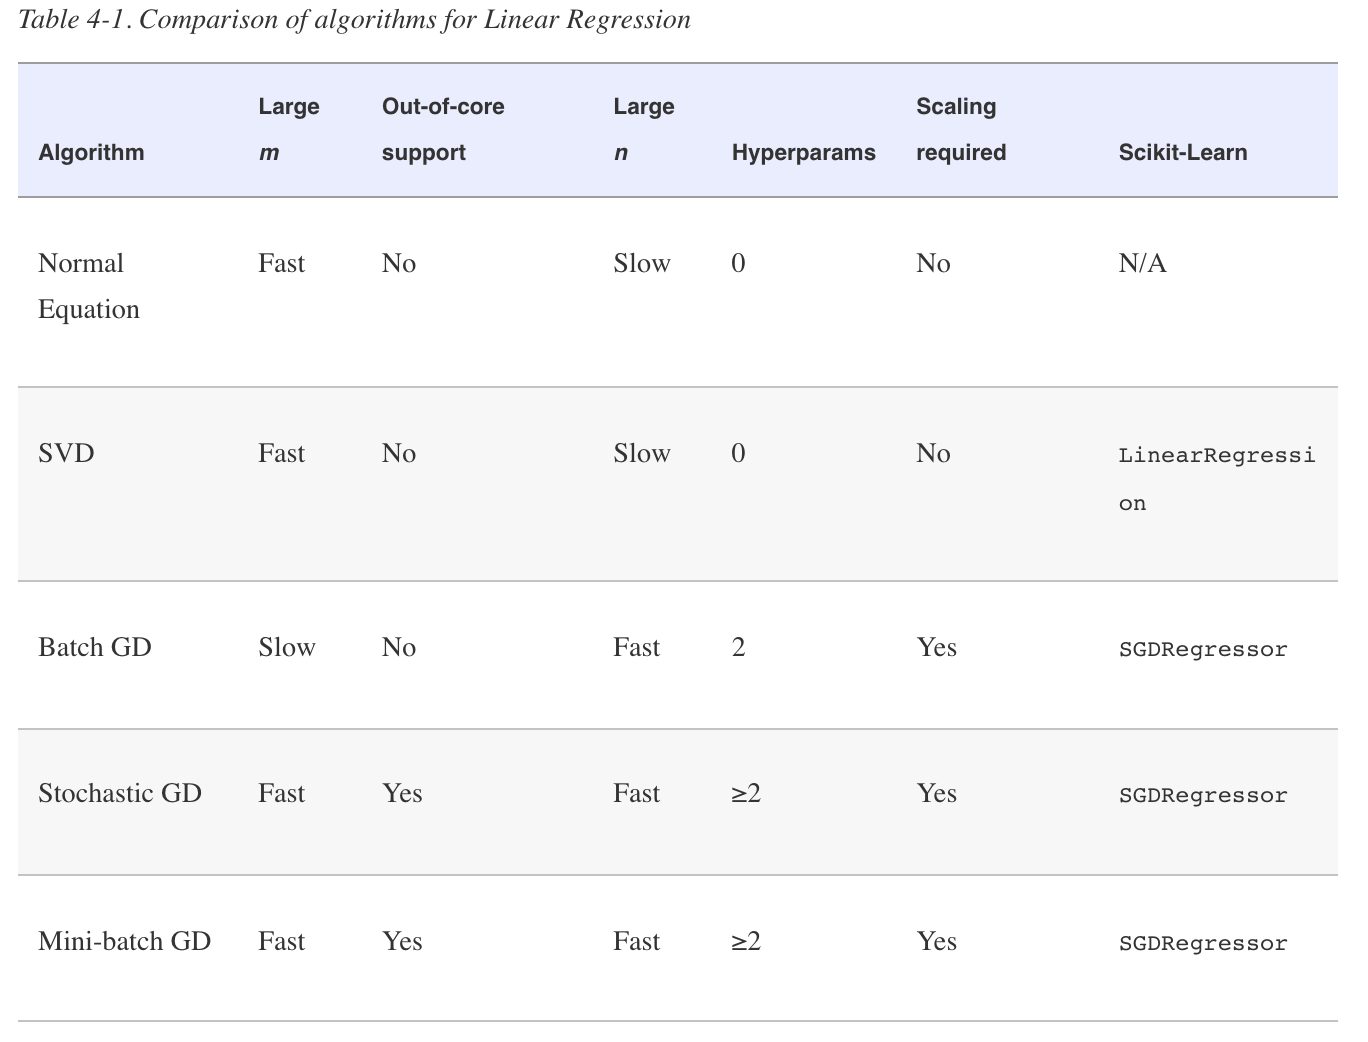
The Normal Equation computes the inverse of $X^{T} X$, which is an $(n + 1) × (n + 1)$ matrix (where $n$ is the number of features). The computational complexity of inverting such a matrix is typically about $O(n^{2.4})$ to $O(n^3)$, depending on the implementation.
NOTE: Both the Normal Equation and the SVD approach get very slow when the number of features grows large (e.g., 100,000). On the positive side, both are linear with regard to the number of instances in the training set (they are $O(m)$), so they handle large training sets efficiently, provided they can fit in memory.
Gradient Descent
Gradient Descent: it measures the local gradient of the error function with regard to the parameter vector θ, and it goes in the direction of descending gradient.
Start by filling θ with random values (this is called random initialization). Then you improve it gradually, taking one baby step at a time, each step attempting to decrease the cost function (e.g., the MSE), until the algorithm converges to a minimum.
An important parameter in Gradient Descent is the size of the steps, determined by the learning rate hyperparameter. If the learning rate is too small, then the algorithm will have to go through many iterations to converge, which will take a long time.
There may be holes, ridges, plateaus, and all sorts of irregular terrains, making convergence to the minimum difficult.
NOTE: When using Gradient Descent, you should ensure that all features have a similar scale (e.g., using Scikit-Learn’s StandardScaler class), or else it will take much longer to converge.
Batch Gradient Descent
partial derivative: calculate how much the cost function will change if you change $θ_j$ just a little bit.
Partial derivatives of the cost function:
\[\frac{\partial}{\partial \theta_{j}} \text{MSE}(\theta) = \frac{2}{m} \sum_{i=1}^{m} (\theta^{\top} x^{(i)} - y^{(i)}) x_j^{(i)}\]Gradient vector of the cost function:
\[\nabla_{\theta} \text{MSE}(\theta) = \begin{pmatrix} \frac{\partial}{\partial \theta_{0}} \text{MSE}(\theta) \\ \frac{\partial}{\partial \theta_{1}} \text{MSE}(\theta) \\ \vdots \\ \frac{\partial}{\partial \theta_{n}} \text{MSE}(\theta)) \\ \end{pmatrix} = \frac{2}{m} \text{X}^{\top} (\text{X} \theta-y)\]NOTE: Batch Gradient Descent: it uses the whole batch of training data at every step (actually, Full Gradient Descent would probably be a better name). As a result it is terribly slow on very large training sets (but we will see much faster Gradient Descent algorithms shortly). However, Gradient Descent scales well with the number of features; training a Linear Regression model when there are hundreds of thousands of features is much faster using Gradient Descent than using the Normal Equation or SVD decomposition.
Gradient Descent step:
\[\theta^{next \ step} = \theta - \eta * \nabla_{\theta} \text{MSE}(\theta)\]How to set number of iterations
A simple solution is to set a very large number of iterations but to interrupt the algorithm when the gradient vector becomes tiny—that is, when its norm becomes smaller than a tiny number ϵ (called the tolerance)—because this happens when Gradient Descent has (almost) reached the minimum.
Stochastic Gradient Descent
Stochastic Gradient Descent picks a random instance in the training set at every step and computes the gradients based only on that single instance. Obviously, working on a single instance at a time makes the algorithm much faster because it has very little data to manipulate at every iteration. It also makes it possible to train on huge training sets, since only one instance needs to be in memory at each iteration.
Stochastic Gradient Descent has a better chance of finding the global minimum than Batch Gradient Descent does.
simulated annealing: The steps start out large (which helps make quick progress and escape local minima), then get smaller and smaller, allowing the algorithm to settle at the global minimum.learning schedule: function that determines the learning rate at each iterationepoch: iterate by rounds of m iterations; each round is called an epoch
NOTE: When using Stochastic Gradient Descent, the training instances must be independent and identically distributed (IID) to ensure that the parameters get pulled toward the global optimum, on average. A simple way to ensure this is to shuffle the instances during training (e.g., pick each instance randomly, or shuffle the training set at the beginning of each epoch).
Mini-batch Gradient Descent
Mini-batch GD computes the gradients on small random sets of instances called mini-batches. The main advantage of Mini-batch GD over Stochastic GD is that you can get a performance boost from hardware optimization of matrix operations, especially when using GPUs.
Polynomial Regression
Polynomial Regression: add powers of each feature as new features, then train a linear model on this extended set of features.
Polynomial Regression is capable of finding relationships between features (which is something a plain Linear Regression model cannot do). ex: if there were two features a and b, PolynomialFeatures with degree=3 would not only add the features a2, a3, b2, and b3, but also the combinations ab, a2b, and ab2.
NOTE: PolynomialFeatures(degree=d) transforms an array containing n features into an array containing $(n + d)! / d!n!$ features, where $n!$ is the factorial of n, equal to $1 × 2 × 3 × ⋯ × n$. Beware of the combinatorial explosion of the number of features!
Learning curves
How can you tell that your model is overfitting or underfitting the data?
==> If a model performs well on the training data but generalizes poorly according to the cross-validation metrics, then your model is overfitting. If it performs poorly on both, then it is underfitting.
TIP:
- If your model is underfitting the training data, adding more training examples will not help. You need to use a more complex model or come up with better features.
- One way to improve an overfitting model is to feed it more training data until the validation error reaches the training error.
A model’s generalization error can be expressed as the sum of three very different errors:
Bias: This part of the generalization error is due to wrong assumptions, such as assuming that the data is linear when it is actually quadratic. A high-bias model is most likely to underfit the training data.Variance: This part is due to the model’s excessive sensitivity to small variations in the training data. A model with many degrees of freedom (such as a high-degree polynomial model) is likely to have high variance and thus overfit the training data.Irreducible error: This part is due to the noisiness of the data itself. The only way to reduce this part of the error is to clean up the data (e.g., fix the data sources, such as broken sensors, or detect and remove outliers).
Increasing a model’s complexity will typically increase its variance and reduce its bias. Conversely, reducing a model’s complexity increases its bias and reduces its variance. This is why it is called a trade-off.
Regularized Linear Models
A good way to reduce overfitting is to regularize the model (i.e., to constrain it): the fewer degrees of freedom it has, the harder it will be for it to overfit the data. A simple way to regularize a polynomial model is to reduce the number of polynomial degrees. For a linear model, regularization is typically achieved by constraining the weights of the model. Take three different constrain weights as example:
- Ridge Regression
- Add
regularization termto the cost function.regularization term: $\alpha \sum_{i=1}^{n} \theta_{i}^2$
- forces the learning algorithm to not only fit the data but also keep the model weights as small as possible
- NOTE: regularization term should only be added to the cost function during training. Once the model is trained, you want to use the unregularized performance measure to evaluate the model’s performance.
- Ridge Regression closed-form solution
- $\hat{\theta}=(X^{\top}X + \alpha A)^{-1} X^{T} y$
- Add
- Lasso Regression
- also called
Least Absolute Shrinkage and Selection Operator Regression - Lasso Regression cost function
-
$J(\theta) = \text{MSE}(\theta) + \alpha \sum_{i=1}^{n} \theta_{i} $
-
- Lasso Regression tends to eliminate the weights of the least important features (i.e., set them to zero). => automatically performs feature selection and outputs a sparse model (i.e., with few nonzero feature weights).
- also called
- Elastic Net.
- control the mix ratio r. When r = 0, Elastic Net is equivalent to Ridge Regression, and when r = 1, it is equivalent to Lasso Regression
- Elastic Net cost function
-
$J(\theta) = \text{MSE}(\theta) + r \alpha \sum_{i=1}^{n} \theta_{i} + \frac{1-r}{2} \alpha\sum_{i=1}^{n}\theta_{i}^2$
-
Early Stopping: stop training as soon as the validation error reaches a minimum.
TIP: With Stochastic and Mini-batch Gradient Descent, the curves are not so smooth, and it may be hard to know whether you have reached the minimum or not. One solution is to stop only after the validation error has been above the minimum for some time (when you are confident that the model will not do any better), then roll back the model parameters to the point where the validation error was at a minimum.
Logistic Regression
Logistic Regression: (also called Logit Regression) is commonly used to estimate the probability that an instance belongs to a particular class.
If the estimated probability is greater than 50%, then the model predicts that the instance belongs to that class (called the positive class, labeled “1”), and otherwise it predicts that it does not (i.e., it belongs to the negative class, labeled “0”). This makes it a binary classifier.
Estimating Probabilities
Logistic Regression model estimated probability (vectorized form):
\[\hat{p} = h_{\theta}(x) = \sigma(\theta^{\top}x)\]Logistic function:
\[\sigma(t) = \frac{1}{1+\text{exp}(-t)}\]Logistic Regression cost function (log loss):
\[J(\theta) = - \frac{1}{m} \sum_{i=1}^{m} [y^{(i)}log(\hat{p}^{(i)}) + (1-y^{(i)})log(1-\hat{p}^{(i)})]\]Softmax Regression
Softmax Regression, or Multinomial Logistic Regression: when given an instance x, the Softmax Regression model first computes a score sk(x) for each class k, then estimates the probability of each class by applying the softmax function (also called the normalized exponential) to the scores. The equation to compute sk(x) should look familiar, as it is just like the equation for Linear Regression prediction
Softmax score for class k:
\[s_k(x) = (\theta^{(k)})^{\top} x\]Softmax function:
\[\hat{p_k} = \sigma(s(x))_k = \frac{\text{exp}(s_k)(x)}{\sum_{j=1}^{K} \text{exp}(s_j(x))}\]Cross entropy cost function:
\[J(\Theta) = - \frac{1}{m} \sum_{i=1}^{m} \sum_{i=1}^{K}y_k^{(i)}log(\hat{p_k}^{(i)})\]Cross entropy gradient vector for class k:
\[\nabla_{\theta^{(k)}}J(\Theta) = \frac{1}{m} \sum_{i=1}^{m}(\hat{p_k}^{(i)}-y_k^{(i)})x^{(i)}\]
Comments
Join the discussion for this article at here . Our comments is using Github Issues. All of posted comments will display at this page instantly.