Scroll hitches
Scroll hitches:
When a rendered frame does not end up on-screen at its expected time

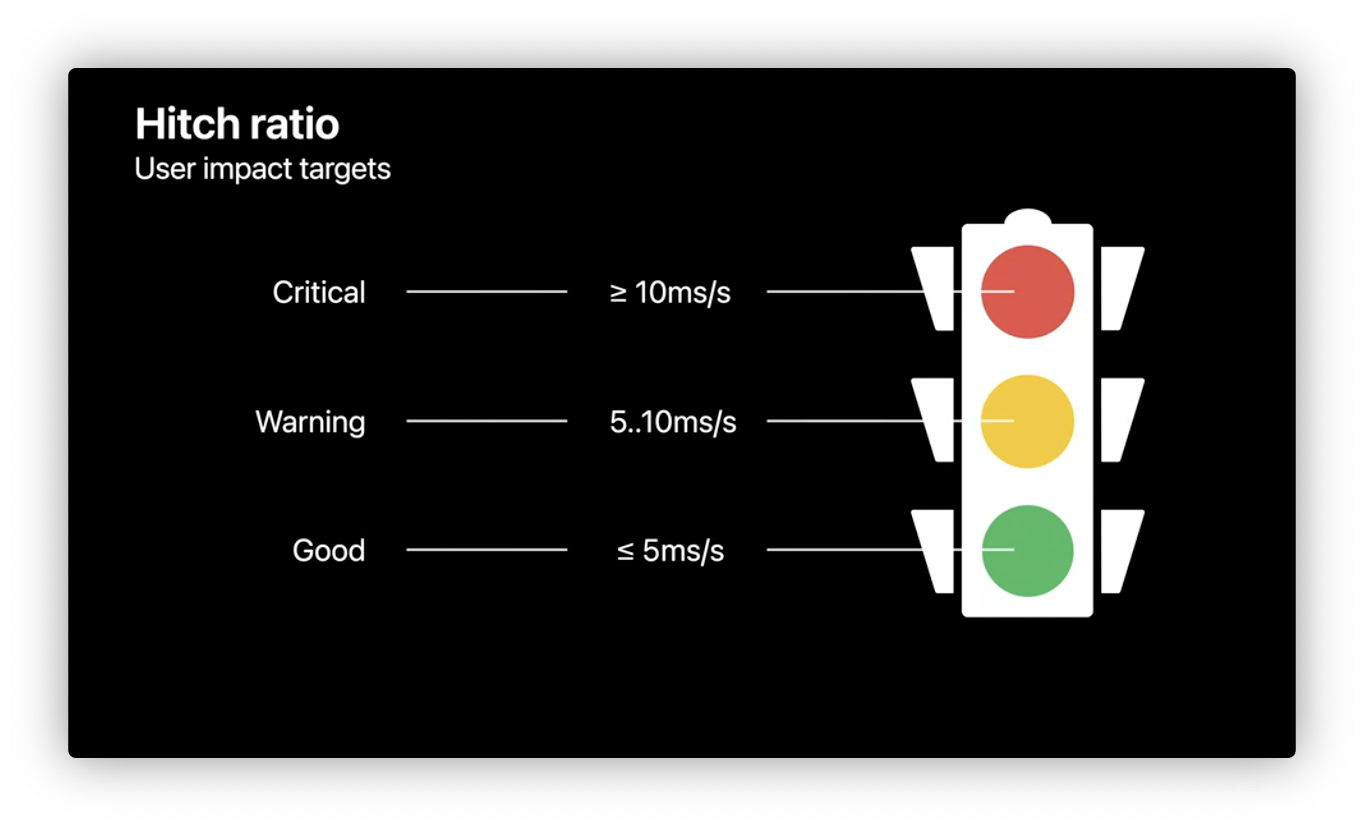
- Hitch Time: Time in ms that a frame is late to display
- Hitch Ratio: Hitch time in ms per second for a given duration

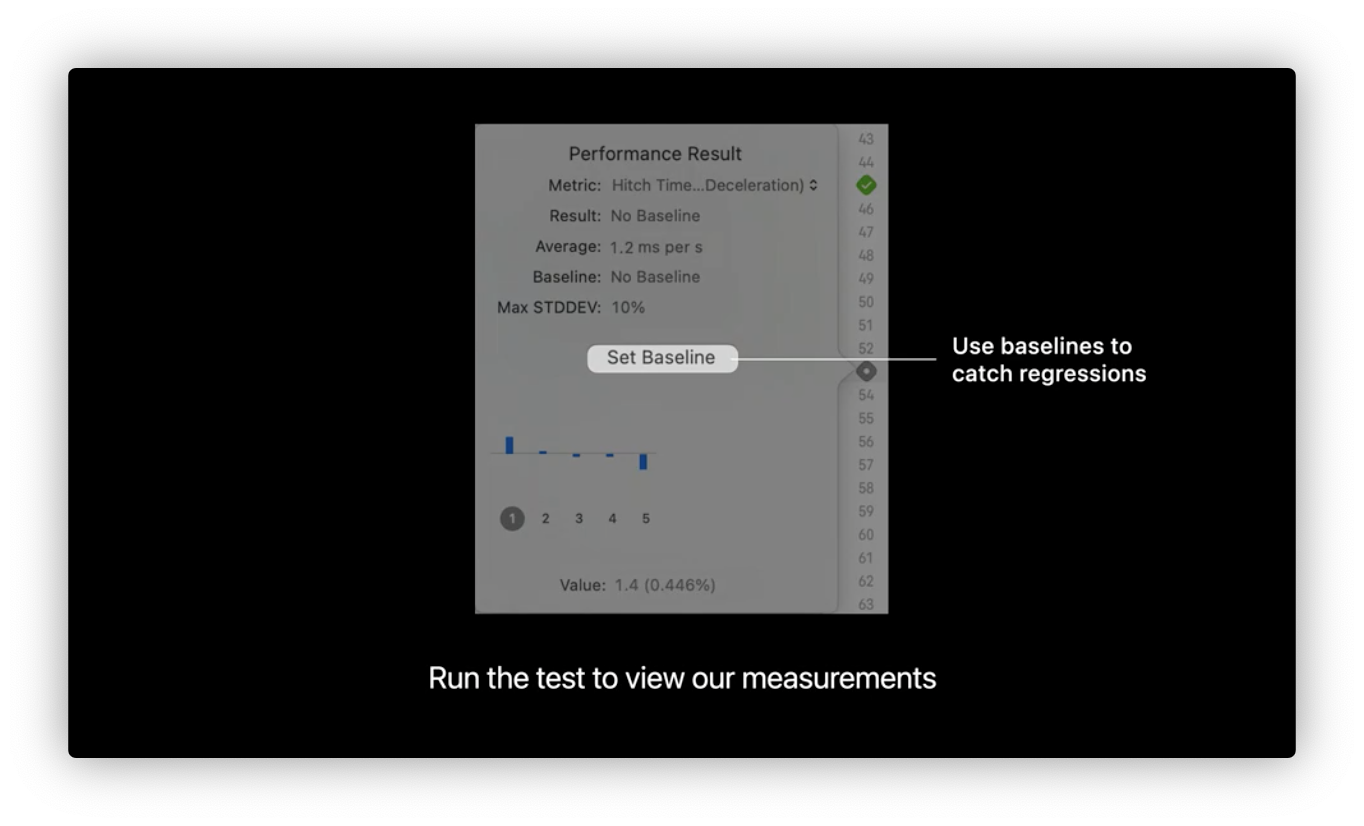
Catch Hitches using Performance XCTests
Xcode11 introduce XCTMatric, which can gather metrics during performance tests.
Inside it, XCTOSSignpostMetric is a metric to record the time a performance tests spends executing a signposted region of code.
- Duration
- Total count of hitches
- Total duration of hitches
- Hitch time ratio
- Frame rate
- Frame count
Emit an os_signpost interval
- Non-animation interval
- Custom
os_signpostwith.begin
- Custom
- Animation interval
- Custom
os_signpostwith.animationBegin - UIKit instrumented animation interval
- Custom
/*
 Create an animation os_signpost interval
 Use `.animationBegin`
*/
os_signpost(.animationBegin, log: logHandle, name: "performAnimationInterval")
os_signpost(.end, log: logHandle, name: "performAnimationInterval")

/*
Use a UIKit instrumented animation os_signpost interval
*/
extension XCTOSSignpostMetric {
     open class var navigationTransitionMetric: XCTMetric { get }
     open class var customNavigationTransitionMetric: XCTMetric { get }
     open class var scrollDecelerationMetric: XCTMetric { get }
     open class var scrollDraggingMetric: XCTMetric { get }
}

// TEST

// Measure scrolling animation performance using a Performance XCTest
func testScrollingAnimationPerformance() throws {
    app.launch()
    app.staticTexts["Meal Planner"].tap()
    let foodCollection = app.collectionViews.firstMatch

    let measureOptions = XCTMeasureOptions()
    measureOptions.invocationOptions = [.manuallyStop]

    measure(metrics: [XCTOSSignpostMetric.scrollDecelerationMetric],
            options: measureOptions) {
        foodCollection.swipeUp(velocity: .fast)
        stopMeasuring()
        foodCollection.swipeDown(velocity: .fast)
    }
}
Before Test, change some settings:
- Select performance test target
- Select
Releasebuild configuration - Disable
Debugger - Disable
Automatic Screenshots - Disable
Code CoveragexXXX$ - Turn off all diagnostic options under
Runtime Sanitization,Runtime API Checking,Memory Management
Test screenshot:

Disk write diagnostics
Created when an app performs more than 1 GB of logical writes within 24hrs


Comments
Join the discussion for this article at here . Our comments is using Github Issues. All of posted comments will display at this page instantly.