This article is introducing the Unified Logging system and how to use it to measure performace.
Unified Logging
From the document:
The unified logging system provides a single, efficient, performant API for capturing messaging across all levelsof the system.
The Unified Logging uses Activity Tracing for performance, consolicates kernel and user-space logging.
Why using it
- Compressing data
- Deferring work and data collection
- Managing log message lifecycle
We want as much logging on all the time as possible.
Key Features
- Improved categorization and filtering of log messages
- Logging system collects caller information
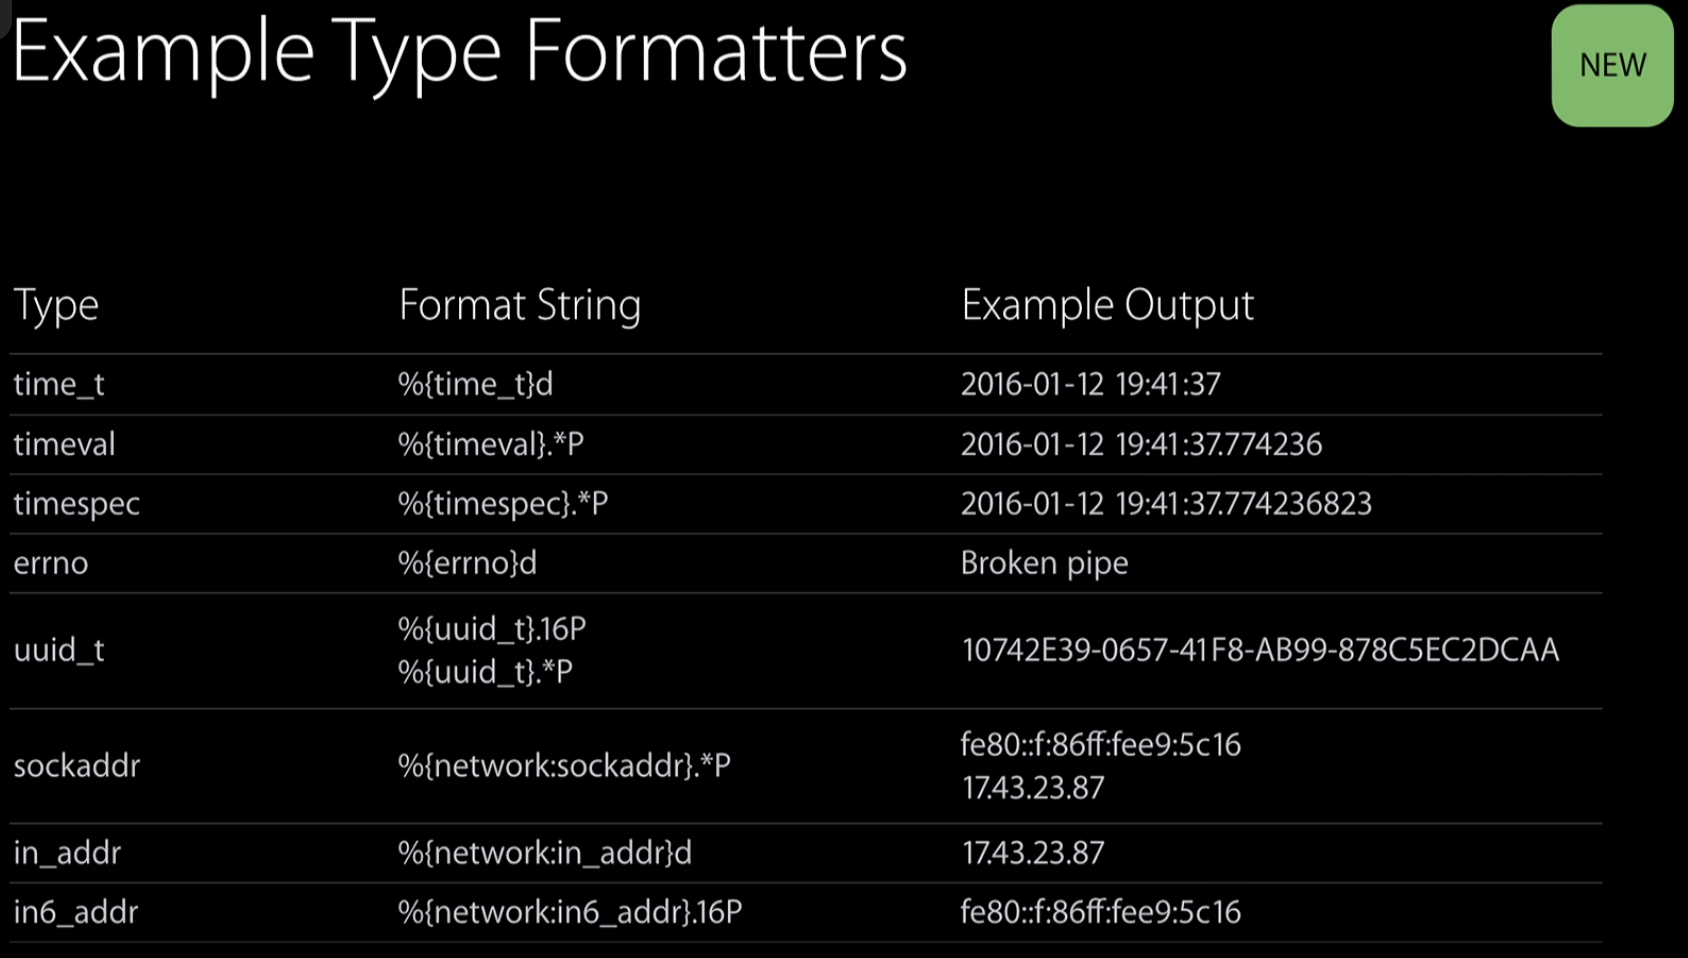
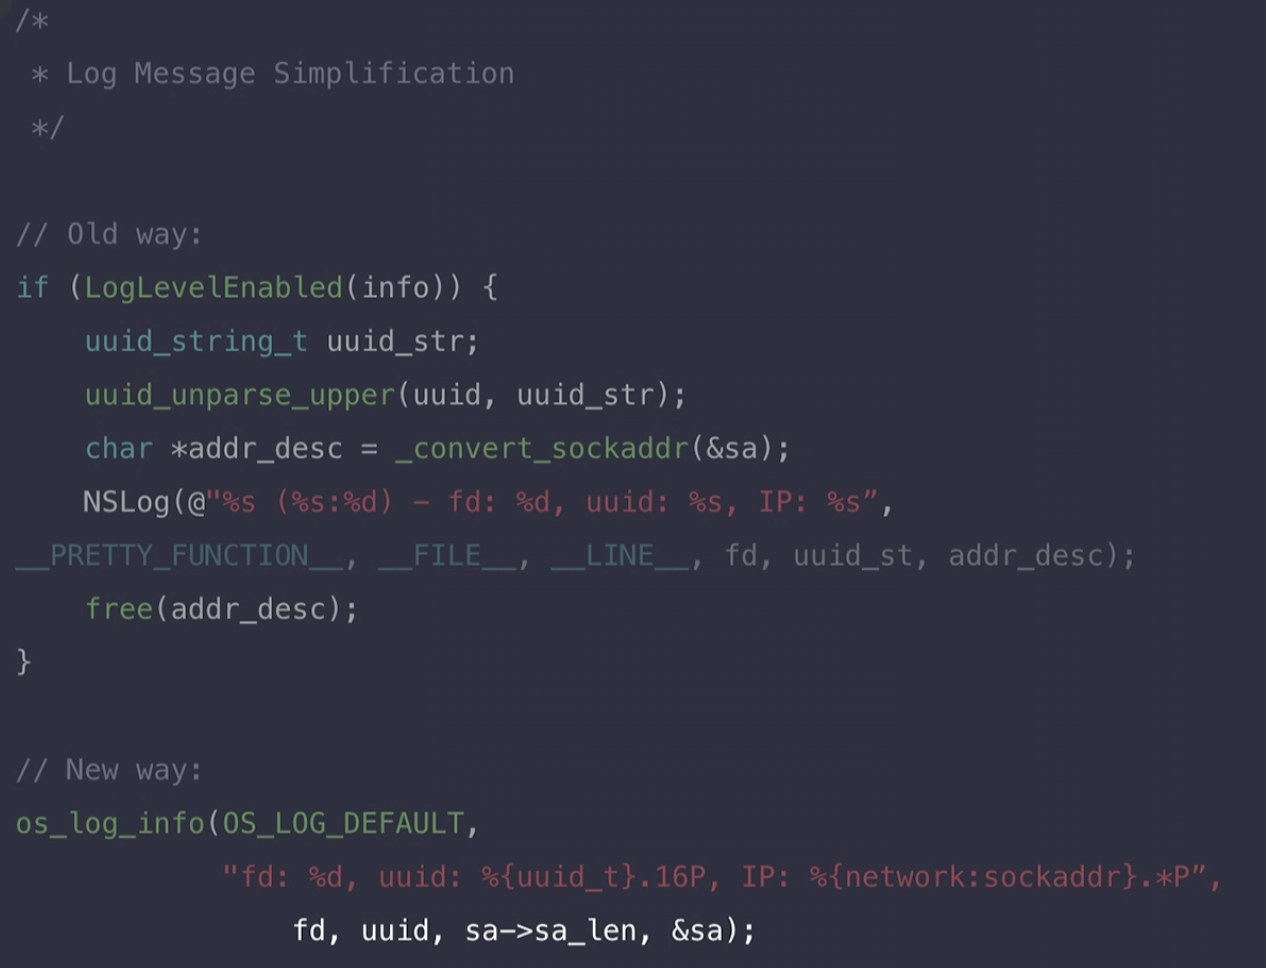
- New Builtin type specifiers - simplifies log message preparation
- New Console application and command-line tool (graph)
- Supported on macOS, iOS, tvOS, watchOS and Simulators
- Support for Objective C, C++, C and Swift
Logging Concepts
Adption
- Build with the macOS 10.12, iOS 10.0 or watchOS 3.0 SDK
- Legacy APIs(NSLog, as_log_message, syslog…) redirected into new system
- Log data will be in new format and location
New File Formats
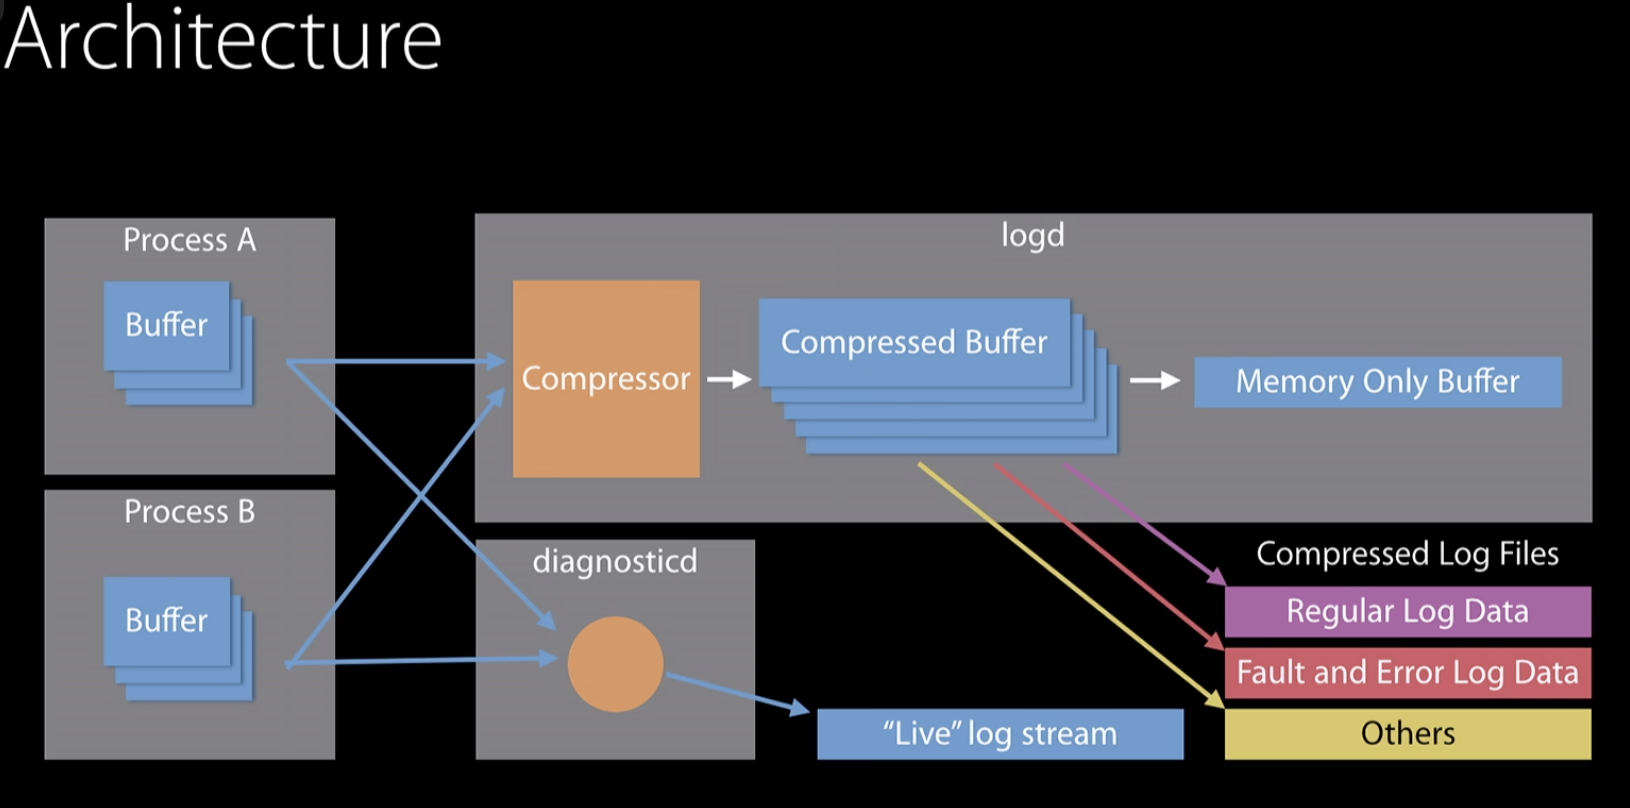
- Log data is kept in a compressed binary format:
.tracev3files - Stored under
/var/db/diagnosticswith support in/var/db/uuidtext .logarchiveformat for portability of logs (collection of log data, easier to transfer to email or …)
Subsystems and Categories
- Log messages can be associated with a subsystem and category
- Can be used to control how log messages are fitered and displayed
- A subsystem can contain multiple categories
Your application will have own subsystems and categories as needed.
Logging Behavior
Each log message has a level determined by the API used
- Three basic levels – Default, Info, Debug
- Two special levels – Fault, Error
Each basic levels has two characteristics that can be set for system, subsystem, or category
- Need to check if it is enabled (Default messages are always enabled)
- Is it stored to disk or memory? (Fault or Error are always stored to disk.)
The levels are hierarchical
- Setting Debug to go to disk implies that Info will also go to disk
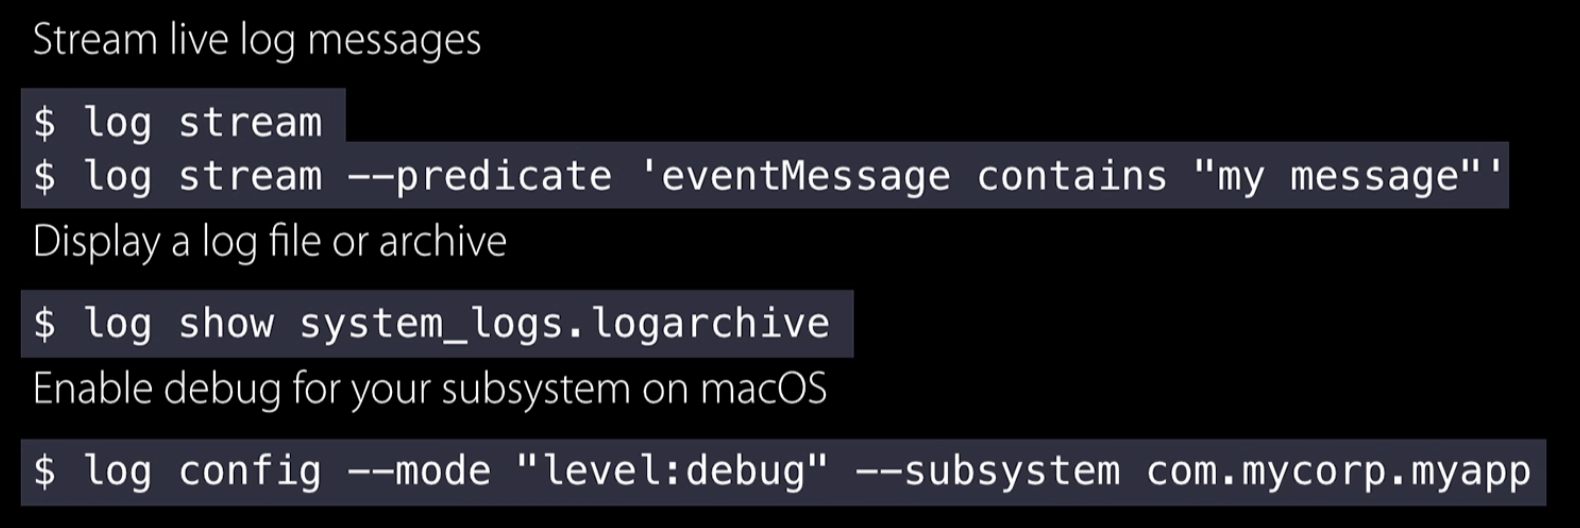
Behavior can be customized by installing profiles or, on macOS, via log command
Standard Behavior
| Message Level | Enabled | Destination |
|---|---|---|
| DEFAULT LEVEL | ALWAYS | DISK |
| INFO LEVEL | YES | MEMORY |
| DEBUG LEVEL | NO | N/A |
| ERROR | ALWAYS | DISK |
| FAULT | ALWAYS | DISK |
Privacy
Prevent accidental logging of Personally Identifiable Information(PII)
Faults and Errors
- Errors – represent issues discovered within a given application/library
- Faults – represent more global problems in the system
- Faults and Error log information is captured into a seperate set of log files (They will exsit longer than normal logs)
Architecture
Type Formatters
Parameter Privacy
Privacy is handled on a parameter by parameter basis
Scalars and Static strings are assumed to be public
Dynamic strings, collections and objects are assumed to be private
Demo
Here is the changing :
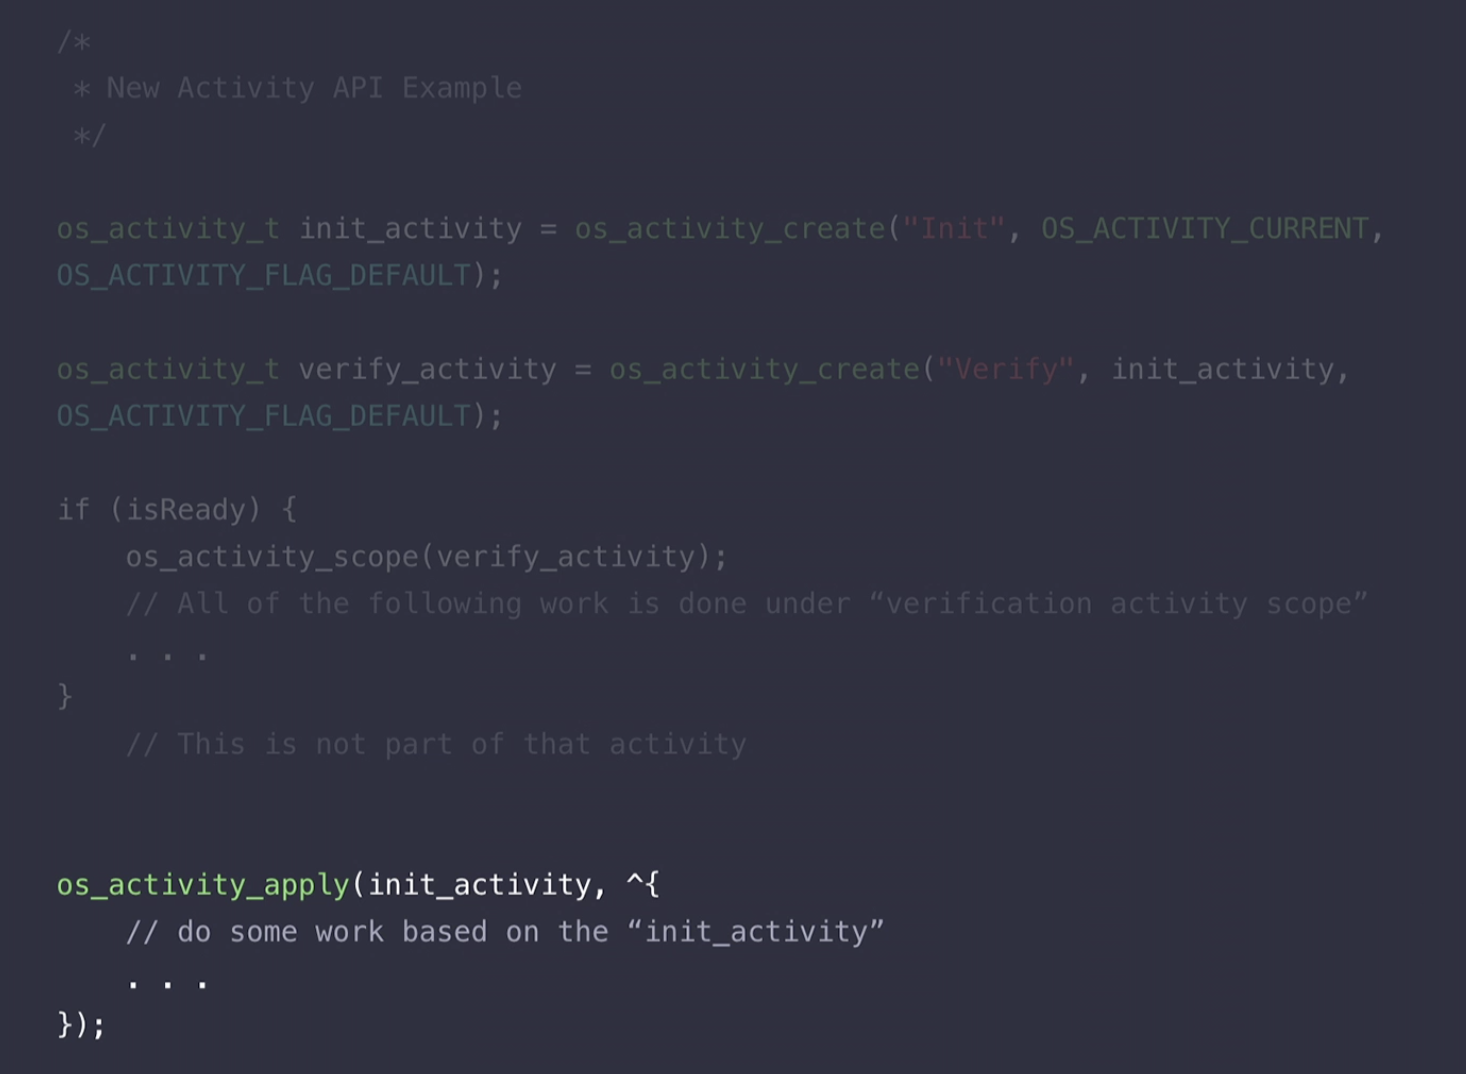
Activity API Improvements
Activites are not objects that can be stored and re-used
- Direct control of activity relationships during creation
New API to auto-scope activites within the code
Tools
Console
- View live content form a system
- Open log archives
- New Activity centric view of logging and tracing
- Advanced filtering and searching
- Device support
log Command Line Tool
Logging Etiquette
- Ensure messages contain only information useful for debugging
- Leverage built-in formatters
- Avoid creating wrapper functions for
os_logAPIs - Log only what you need from collections (Dictionaries, Arrays, etc)
- Avoid logging in tight code loops
Suggest
- Use
os_logto log critical details to help debug issues - Use
os_log_infofor additional info that will be captured during error or fault - Use
os_log_debugfor high-volume debugging during development - Use
os_log_errorto cause additional information capture from app - Use
os_log_faultto cause additional information capture from system
Using sysdiagnose
sysdiagnose is the preferred method to capture data for bug reports
- Unified logging data in
system_logs.archive
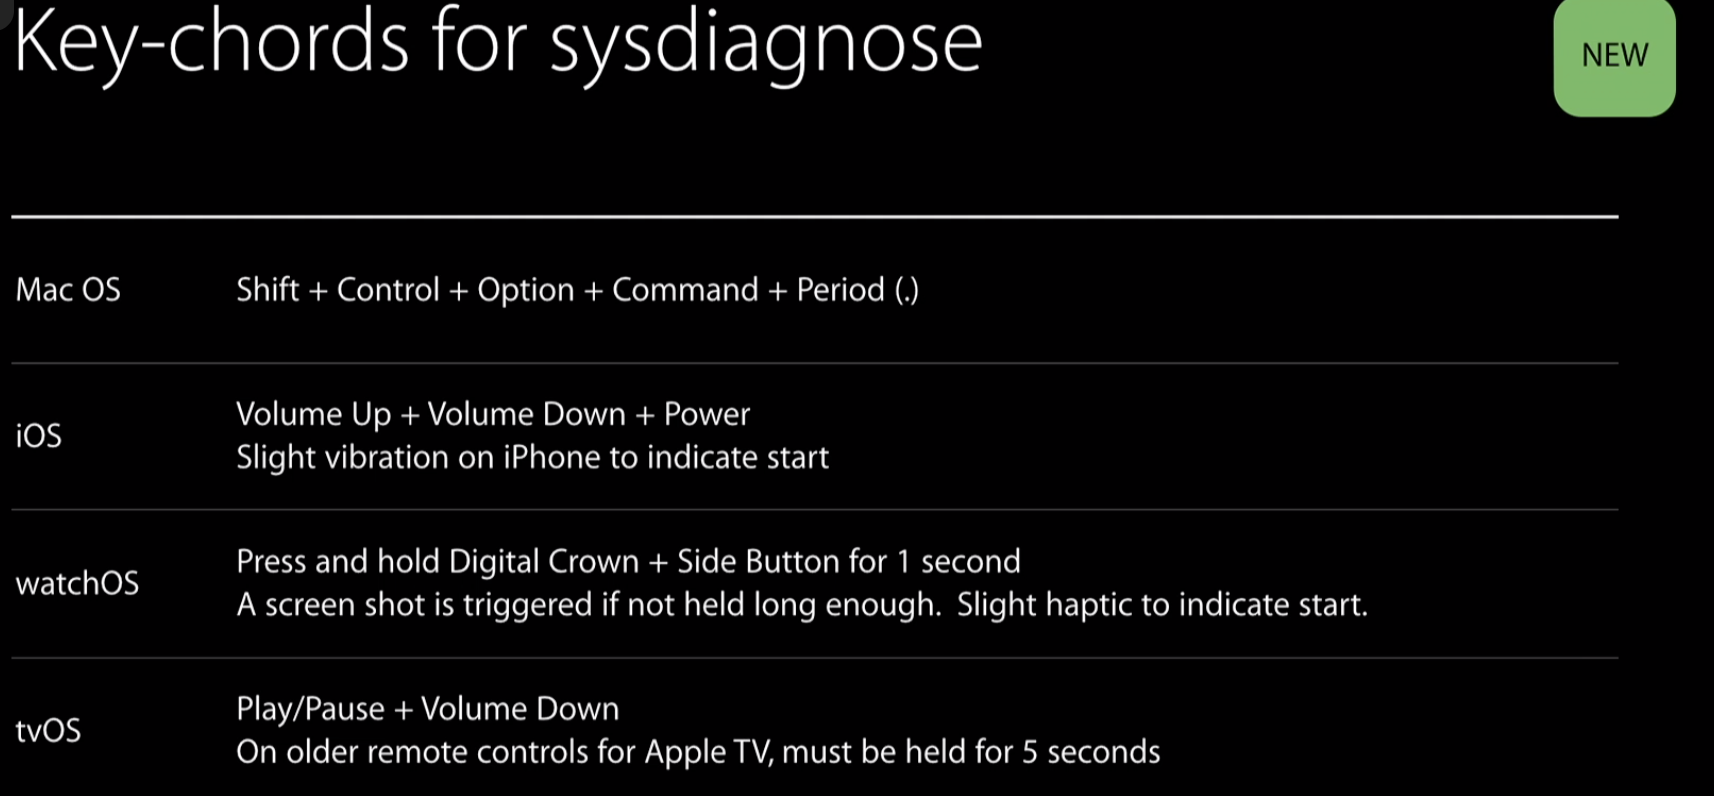
Use key-chord to trigger
sysdiagnose on Apple Watch will trigger on both Apple Watch and iPhone
Transfer from device using iTunes
Here are some key-chords
Measure Performance
os_signpost
Instruments can take the data that signposts produce and you could check what your program is doing.
Here is an example:
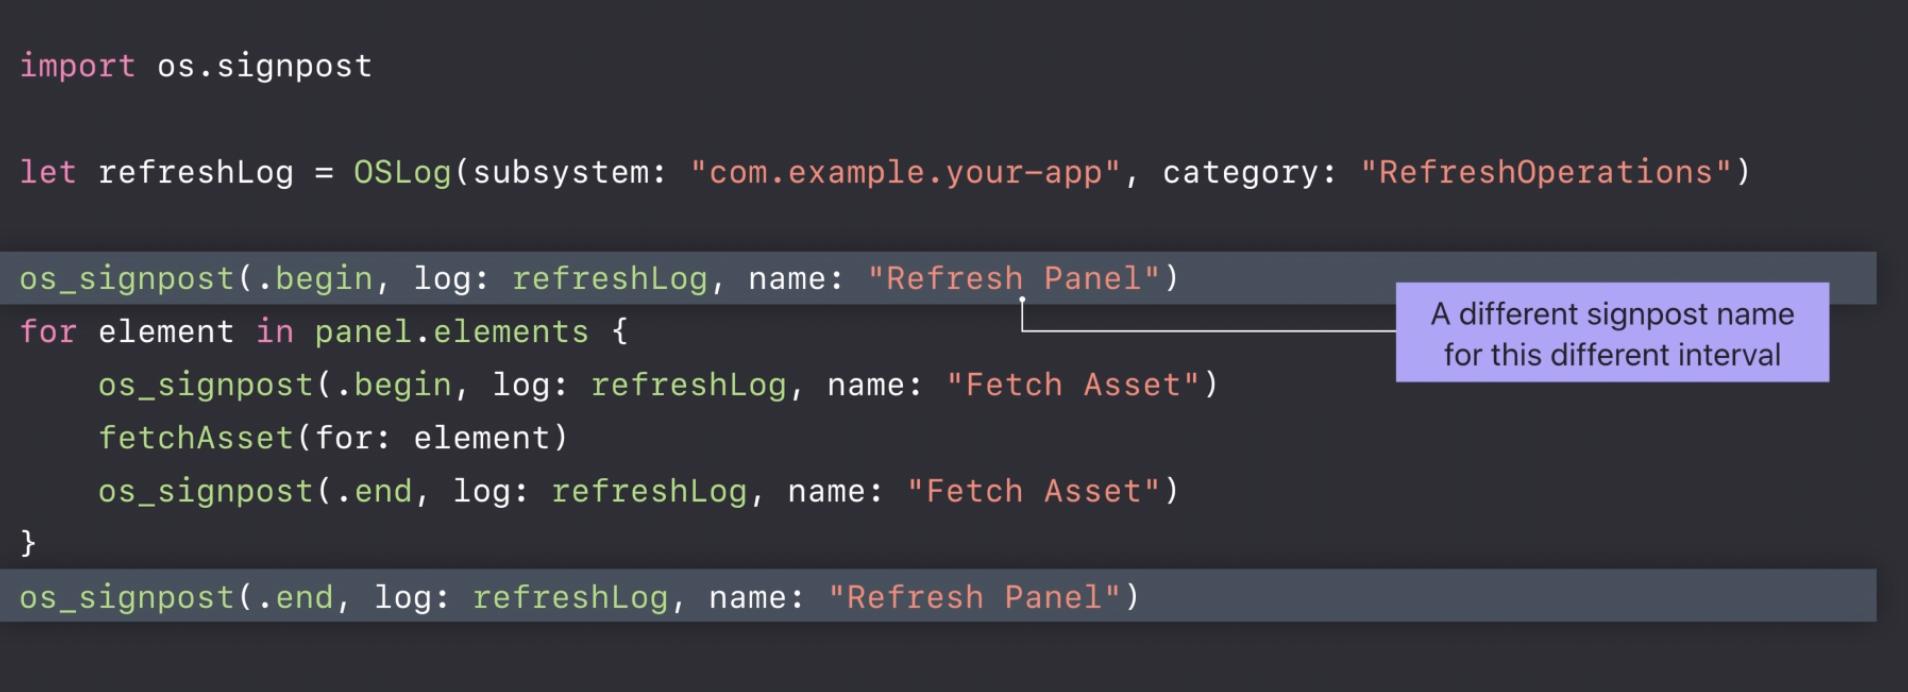
os_signpost allows to mark the beginning and the end(.begin & .end).
Measure Asynchronous Operation
- Signpost Name
- Signpost ID – tell overlapping operations apart
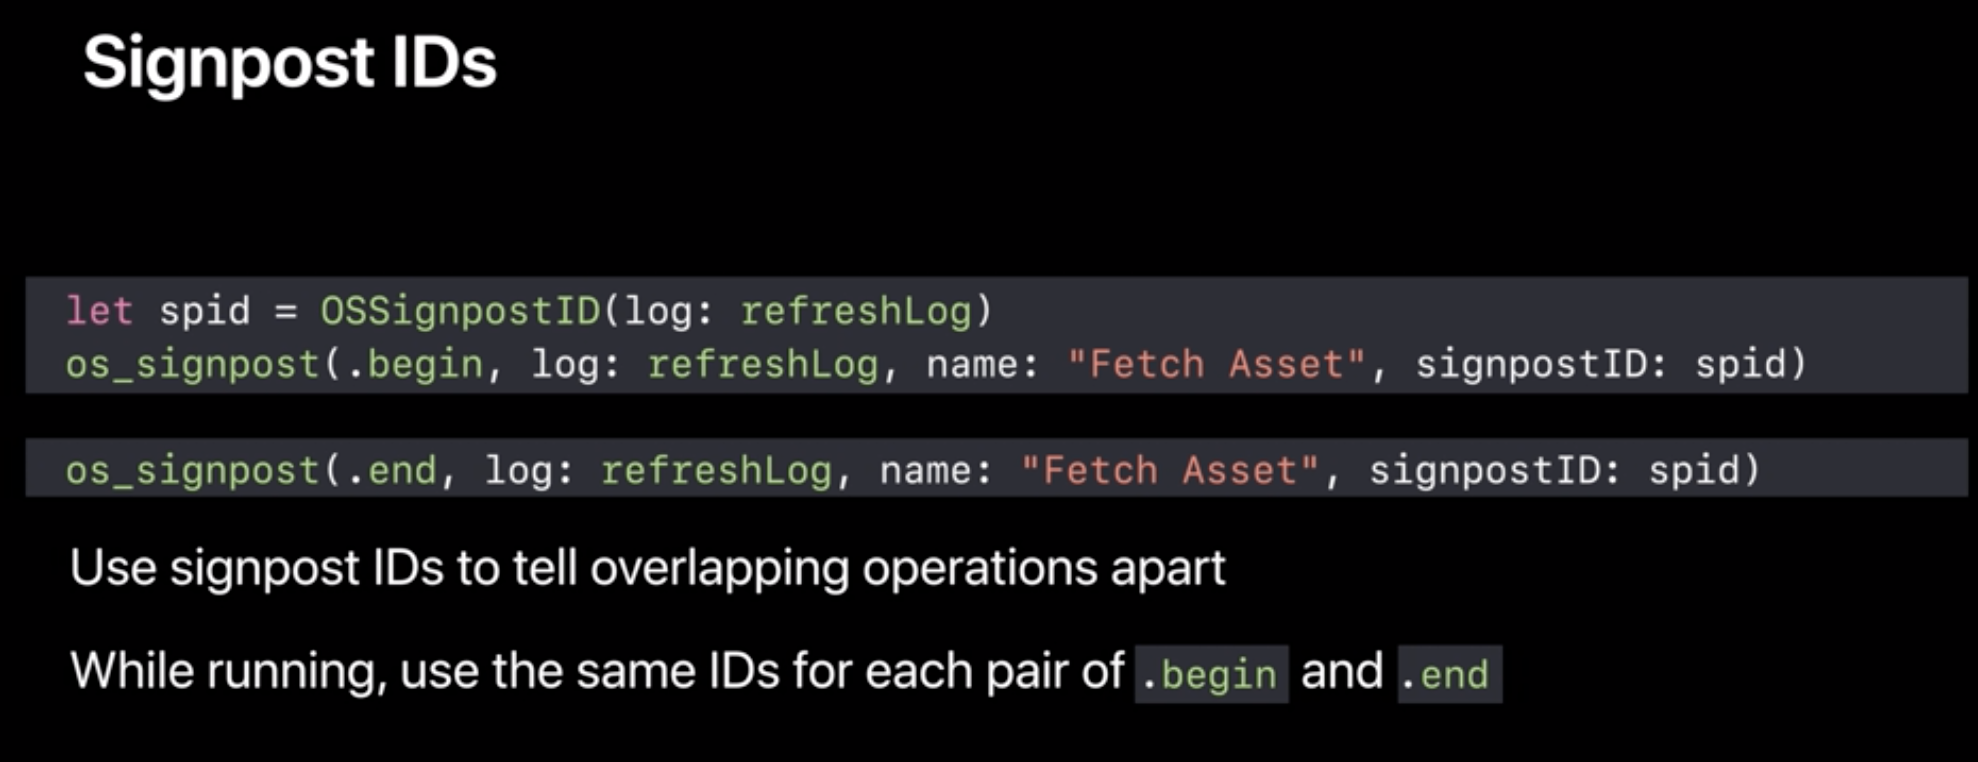
- Making Signpost ID ()
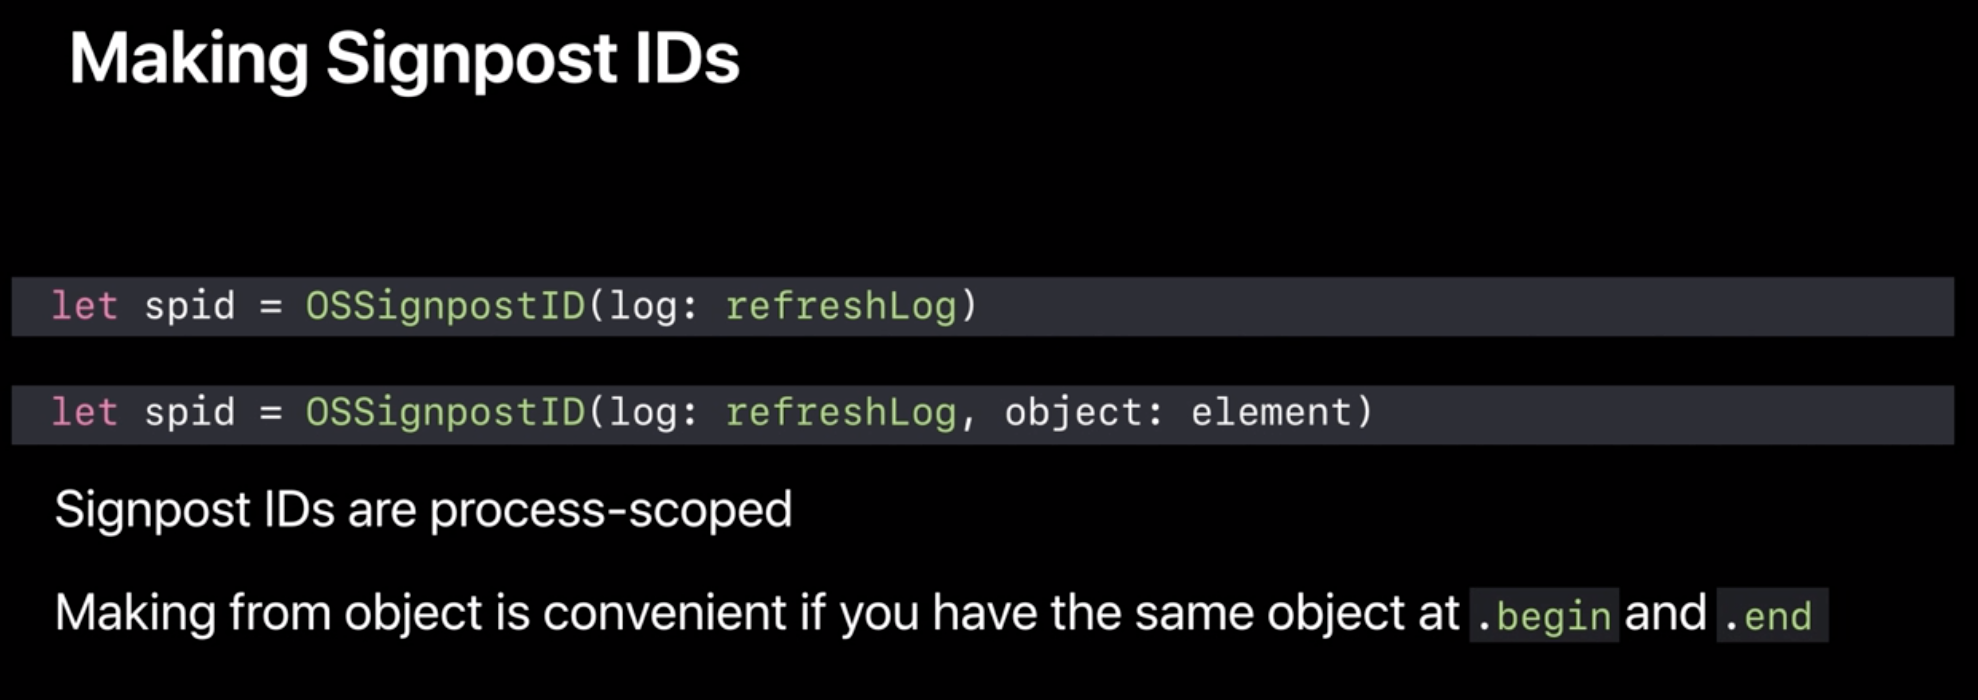
- process-scoped
- making from object is convenient if we have the same object at
.beginand.end - Demo
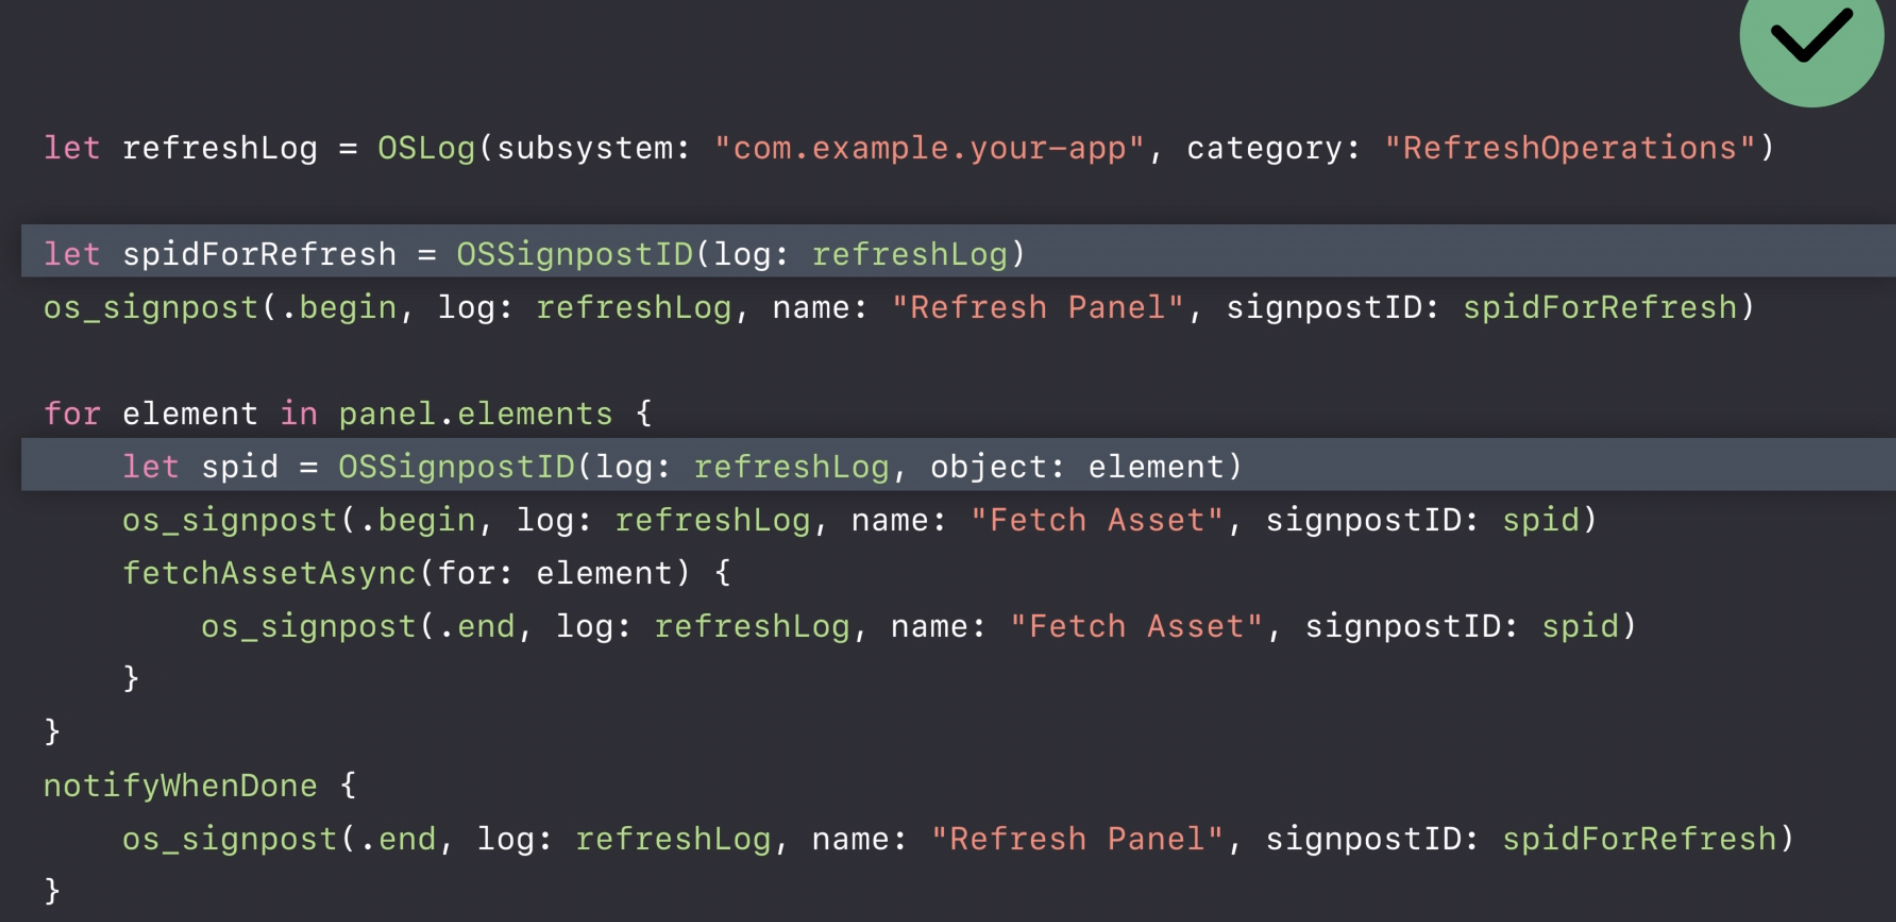
- Making Signpost ID ()
Add Metadata to Signpost
- Add context to the
.beginand.end - Be able to pass arguments with
os_logformat string literal - Pass many arguments with different types
- Pass dynamic strings
Add Independent Event
os_signpost have .event type
Marking a single point
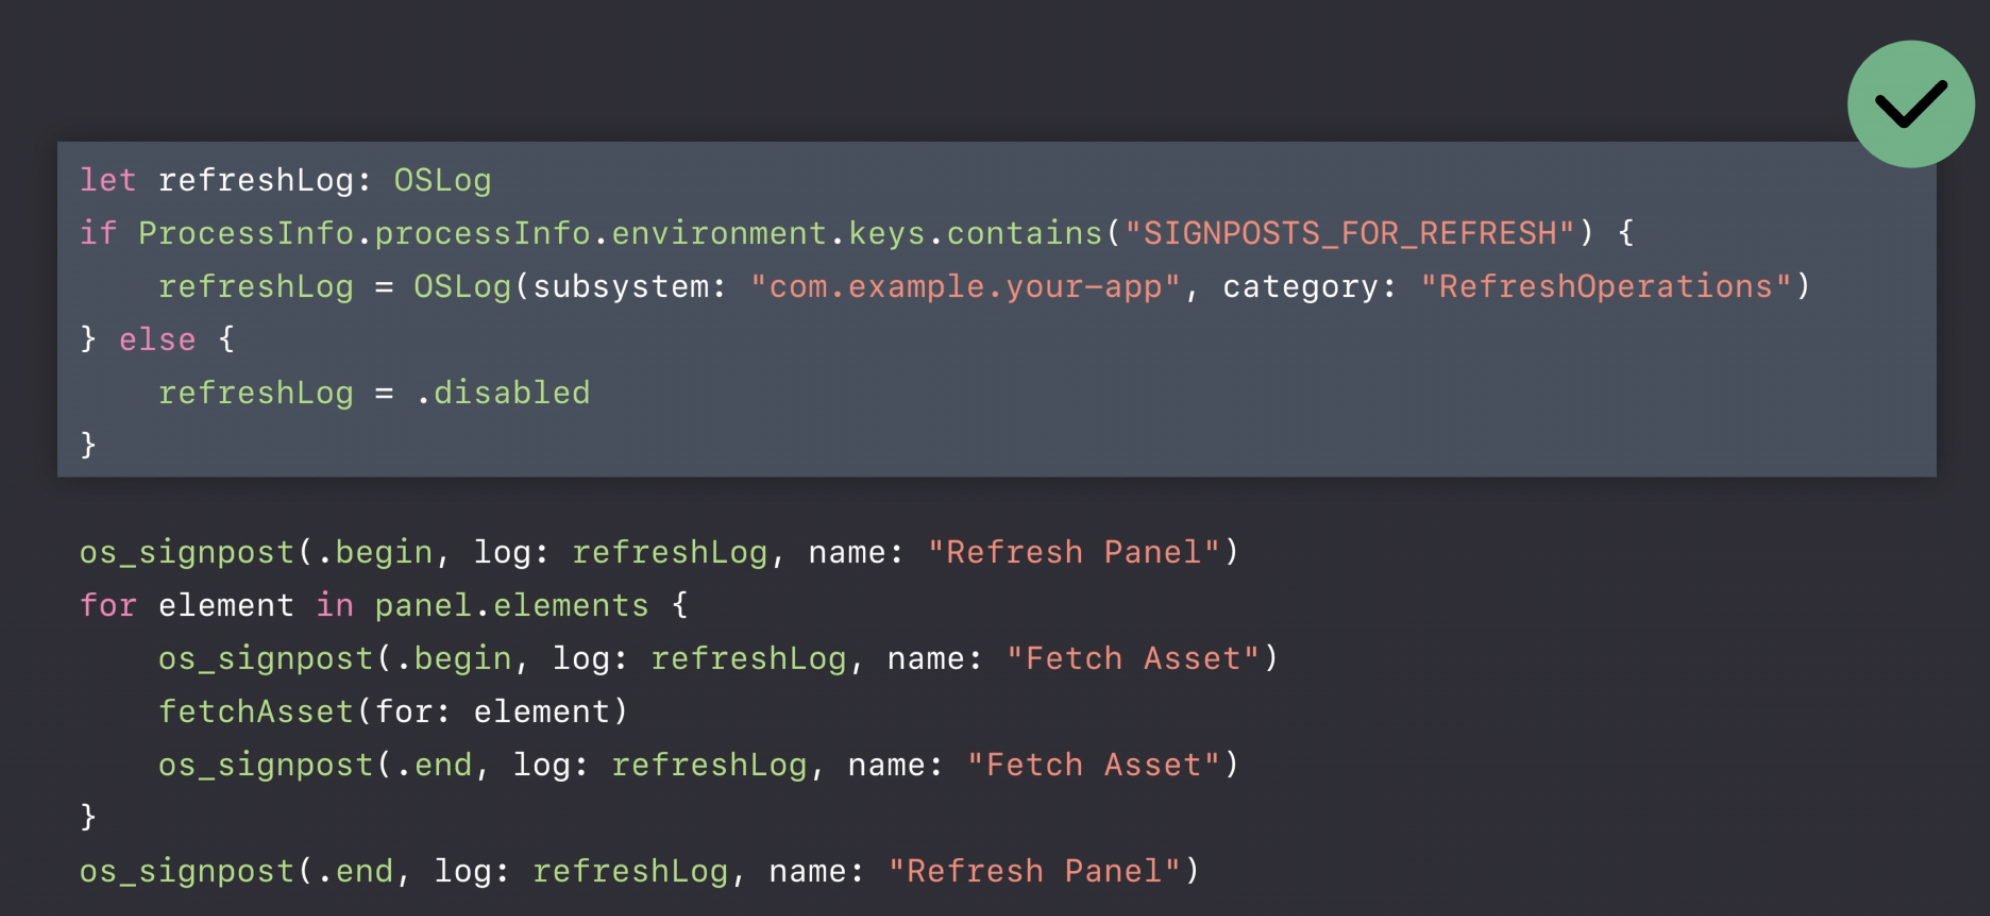
Conditionally Enable Signpost
Signposts are lightweight
- Built to minimize observer effect
- Built for fine-grained measurement in a short time span
OSLog.disabled
Instruments
- Blank -> add
os_signpost - Able to retrieve from
Summarypart - Able to
Recordthe action


Comments
Join the discussion for this article at here . Our comments is using Github Issues. All of posted comments will display at this page instantly.